


Supply Chain Management- Chapter 6-
The Hidden Asset (and Liability): Why Every Unit Matters

Lesson 6: The Balancing Act – Inventory Management
The Hidden Asset (and Liability): Why Every Unit Matters
(Image: A split screen or two-panel infographic. On one side: a well-organized, neatly stacked warehouse with items labeled "Efficiency," "Responsiveness." On the other side: an overflowing, chaotic warehouse with dust and cobwebs, labeled "Costs," "Waste." A large scale icon in the middle, showing a delicate balance between "Having Enough" and "Not Having Too Much.")
Welcome back! In our last lesson, we tackled the crucial task of predicting future demand. Now that we have an idea of what customers will want, the next logical step in supply chain management is figuring out how to store and manage the physical products themselves. This brings us to Inventory Management – a seemingly simple concept with profound implications for a company's profitability and customer satisfaction.
Inventory is much more than just "stuff in a warehouse." It represents a significant investment, a buffer against uncertainty, and a critical component in ensuring smooth operations. Effective inventory management is about striking a delicate balance: having enough to meet demand without incurring excessive costs.
What is Inventory?
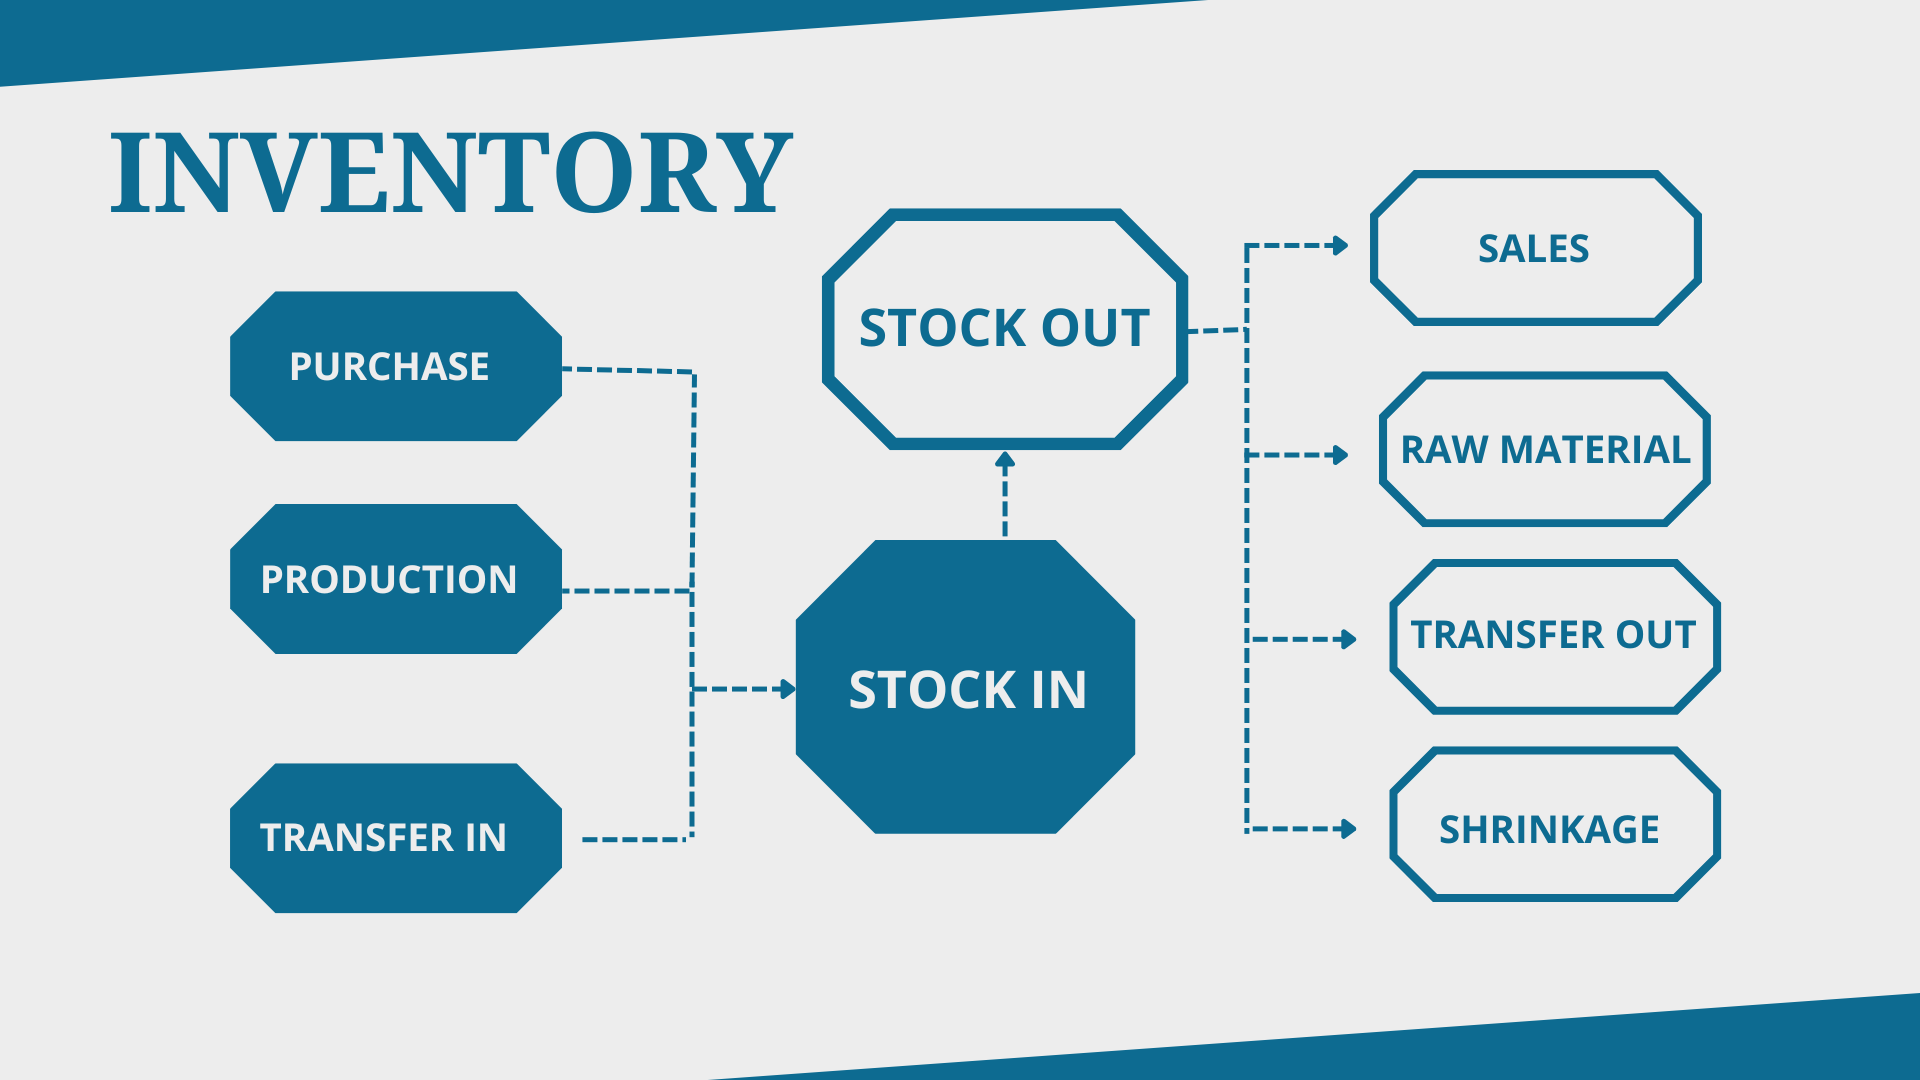
Inventory refers to the stock of any item or resource used in an organization. In a supply chain context, this typically includes:
Raw Materials: Basic inputs that have not yet undergone any processing (e.g., steel, cotton, plastic pellets).
Work-In-Process (WIP): Partially completed products that are still in the production process (e.g., car body on an assembly line, half-finished garment).
Finished Goods: Products that are complete and ready for sale to customers (e.g., bottled soda, completed smartphone, boxed cereal).
MRO (Maintenance, Repair, and Operating Supplies): Items used to support the production process and the facility, but not directly part of the product itself (e.g., lubricants for machines, cleaning supplies, spare parts).
(Image: Four distinct icons or small illustrations representing each type of inventory: a bundle of raw materials, a partial assembly, a boxed finished product, and a wrench/oil can for MRO.)
The Purpose of Inventory: Why Do We Hold It?
If holding inventory is costly, why do companies do it? Inventory serves several strategic purposes:
To Meet Anticipated Demand: The most obvious reason. We forecast demand, and we hold inventory to ensure we can fulfill customer orders.
To Smooth Production Requirements: Allows for a stable production rate even if demand fluctuates. Build up inventory during low demand to meet high demand periods, avoiding expensive overtime or idle capacity.
To Decouple Operations: Acts as a buffer between different stages of the production process or between sequential supply chain partners. If one stage experiences a delay, the next stage isn't immediately stopped due to lack of input.
To Protect Against Stockouts (Safety Stock): Uncertainty in demand or lead time (time to receive an order) means actual demand might exceed expectations. Safety stock is held to cover these unforeseen variations.
To Take Advantage of Quantity Discounts: Buying in larger quantities can reduce the per-unit cost of materials or transportation.
To Hedge Against Price Increases: Purchasing more inventory now if raw material prices are expected to rise in the future.
(Image: Six small, distinct icons, each illustrating a purpose: a calendar for anticipated demand, a smooth waveform for production smoothing, two gears for decoupling, a shield for safety stock, a percentage sign for discounts, a piggy bank for hedging.)
The Costs Associated with Inventory: The Hidden Drain
While inventory serves vital purposes, it comes with significant costs. These are often underestimated:
Holding (or Carrying) Costs: The costs associated with storing and maintaining inventory. These can be substantial.
Capital Cost (Opportunity Cost): The cost of money tied up in inventory that could be invested elsewhere. Often the largest component.
Storage Space Costs: Rent, utilities, maintenance, depreciation of warehouse equipment.
Service Costs: Insurance, taxes on inventory.
Risk Costs: Obsolescence (product becomes outdated), spoilage/damage, shrinkage (theft, loss).
(Image: A stack of money or a piggy bank with an arrow pointing away, labeled "Opportunity Cost." Next to it, a picture of a dusty, outdated product, labeled "Obsolescence.")
Ordering (or Setup) Costs: The costs associated with placing and receiving an order from a supplier, or setting up a production run.
Purchasing Costs: Processing requisitions, purchase orders, receiving inspections.
Setup Costs: Changing tools, cleaning equipment, administrative costs of starting a new production batch.
(Image: A clipboard with a pen, representing administrative order costs. A machine with tools, representing production setup.)
Shortage (or Stockout) Costs: The costs incurred when demand exceeds available inventory.
Lost Sales/Profit: Customers go elsewhere.
Loss of Goodwill/Customer Loyalty: Damaged reputation.
Expediting Costs: Paying extra for rush orders or premium shipping.
Production Delays: If raw materials are short, production stops.
(Image: An empty shelf in a store. A frowning customer. A "LOST SALE" stamp.)
The Challenge: Effective inventory management aims to minimize the sum of these three cost categories.
Inventory Models: Tools for Optimal Decisions
To help managers make informed decisions about how much and when to order, various quantitative models have been developed.
1. Economic Order Quantity (EOQ) Model
Purpose: Determines the optimal order quantity that minimizes the total annual cost of holding inventory and ordering it. It balances holding costs (which increase with order size) and ordering costs (which decrease with order size).
Assumptions (Simplified Model):
Demand is known and constant.
Lead time is known and constant.
Receipt of inventory is instantaneous.
No quantity discounts.
No stockouts allowed.
Formula: EOQ=(2DS/H)
D = Annual Demand (units)
S = Ordering/Setup Cost per order
H = Holding Cost per unit per year
(Image: A simple graph showing two curves: "Holding Cost" (increasing with quantity) and "Ordering Cost" (decreasing with quantity). The point where they intersect (or where their sum is lowest) is labeled EOQ. The total cost curve is also shown as a U-shape.)
Interpretation: The EOQ provides a specific number of units to order each time to achieve the lowest total inventory-related costs.
2. Reorder Point (ROP) Model
Purpose: Determines when to place an order to ensure that new inventory arrives just as the current inventory is about to run out, considering lead time.
Formula (without safety stock): ROP=d∗L
d = Daily or weekly demand (average)
L = Lead Time (in days or weeks, matching 'd' units)
Formula (with safety stock): ROP=(d∗L)+Safety Stock
Safety Stock: Needed to protect against variability in demand during lead time and/or variability in lead time itself. Calculating safety stock involves probability and desired service levels (e.g., using z-scores from a normal distribution).
(Image: A saw-tooth inventory level graph. The inventory decreases over time, hits a "Reorder Point" (ROP) line, an order is placed, and during the "Lead Time," the inventory continues to drop until the new order arrives, bringing the level back up. A small buffer at the bottom represents "Safety Stock.")
Interpretation: When inventory drops to the ROP, it's time to place another order.
Inventory Control Techniques: Managing the Stock
Beyond models, practical techniques help manage diverse inventories.
ABC Analysis:
Concept: Categorizes inventory items based on their annual dollar volume or strategic importance. The "Pareto Principle" (80/20 rule) often applies here.
A-Items (High Value): Represent a small percentage of items (e.g., 10-20%) but account for a large percentage of total inventory value (e.g., 70-80%). Require tight control, accurate forecasting, frequent review.
B-Items (Medium Value): Moderate percentage of items and value. Moderate control.
C-Items (Low Value): Large percentage of items (e.g., 50-70%) but a small percentage of total value (e.g., 5-15%). Simple control, perhaps bulk ordering.
Benefit: Focuses management attention and resources on the most critical inventory items.
(Image: A bar chart or pie chart clearly showing the ABC distribution: a tall, thin bar for "A," a medium bar for "B," and a wide, short bar for "C." Labels indicate percentage of items vs. percentage of value.)
Cycle Counting:
Concept: A continuous inventory auditing method where a small subset of inventory is counted on a daily or weekly basis, rather than a single annual physical inventory count.
Process: Instead of shutting down operations for a painful annual count, designated counters audit specific items, often focusing on "A" items more frequently.
Benefit: Improves inventory record accuracy, identifies errors early, reduces the need for costly annual shutdowns, and helps identify root causes of discrepancies.
(Image: A small calendar with "Daily Counts" marked. A person with a scanner or clipboard checking inventory in a small section of a warehouse, contrasting with a "CLOSED FOR INVENTORY" sign.)
Conclusion: The Heart of Operational Efficiency
Inventory management is a perpetual balancing act. While it serves critical purposes in ensuring product availability and smooth operations, it also ties up significant capital and incurs substantial costs. By understanding the different types and purposes of inventory, rigorously analyzing associated costs, applying quantitative models like EOQ and ROP, and implementing control techniques like ABC analysis and cycle counting, companies can optimize their inventory levels. This optimization is crucial for achieving both cost efficiency and responsiveness, contributing directly to overall supply chain health and profitability.
Looking Ahead...
With inventory controlled, the next challenge is getting it where it needs to go. In Lesson 7, we will shift our focus to Transportation Management, exploring the various modes and strategic decisions involved in moving goods effectively and efficiently across the supply chain.